Smart Sensors Readings
How to display Smart-Sense device readings?
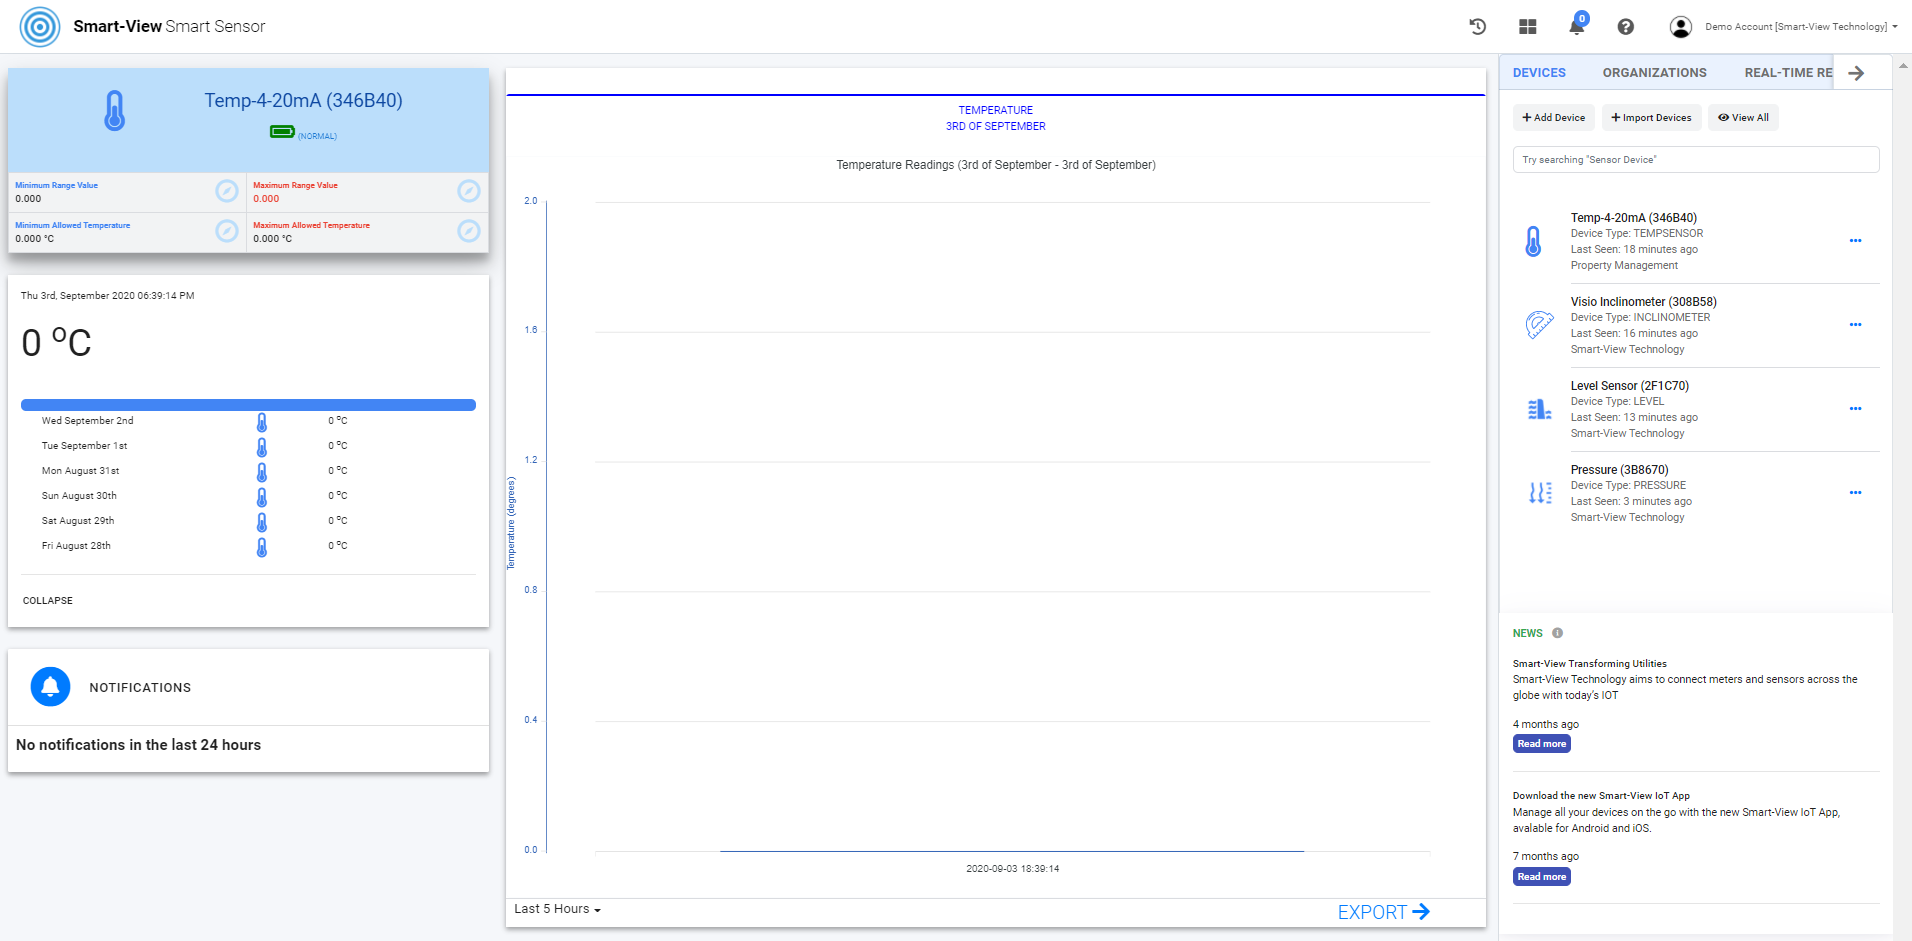
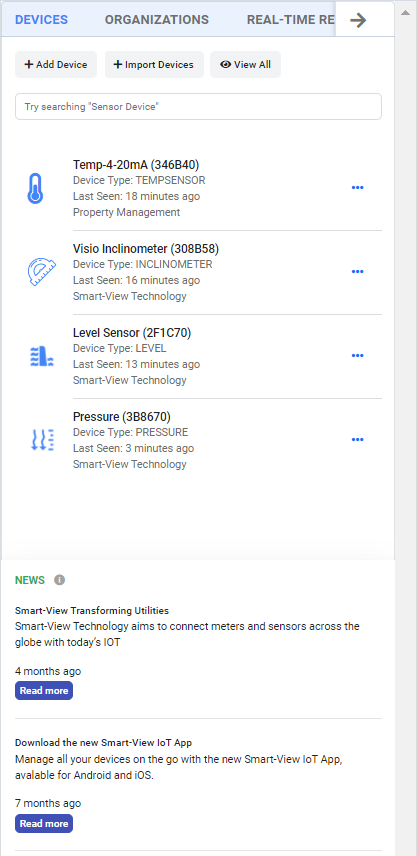
1. From the Smart-View IoT Smart Sensor dashboard navigate to the
side controller(navigation bar) for the list of Smart Sensor devices.
2. By Default there will be a Smart Sensor Device on the Dashboard,
click on the device you wish to view from the side controller and it will pull through on the
Dasboard.
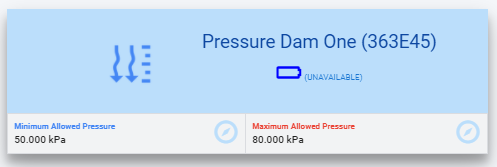
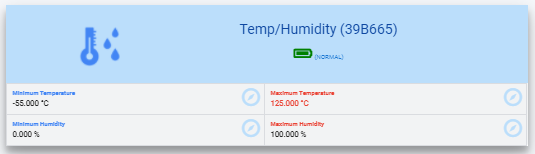
3. The Top left card showcases the device's information (name,
battery status & thresholds)
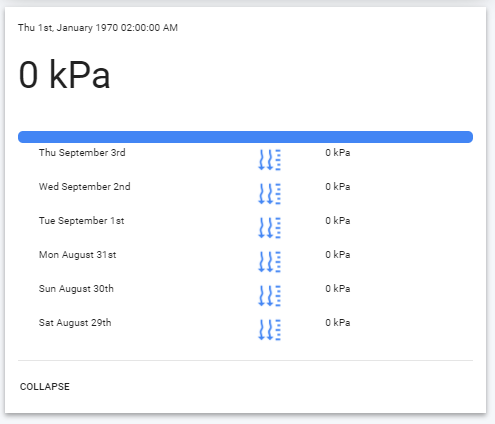
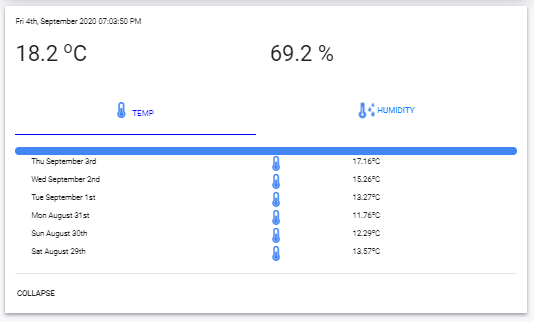
4. The Center left card showcases the device's daily average
readings for the last 6 days
5. The Bottom left card showcases the device's threshold breaches
notifications in the last 24 hours
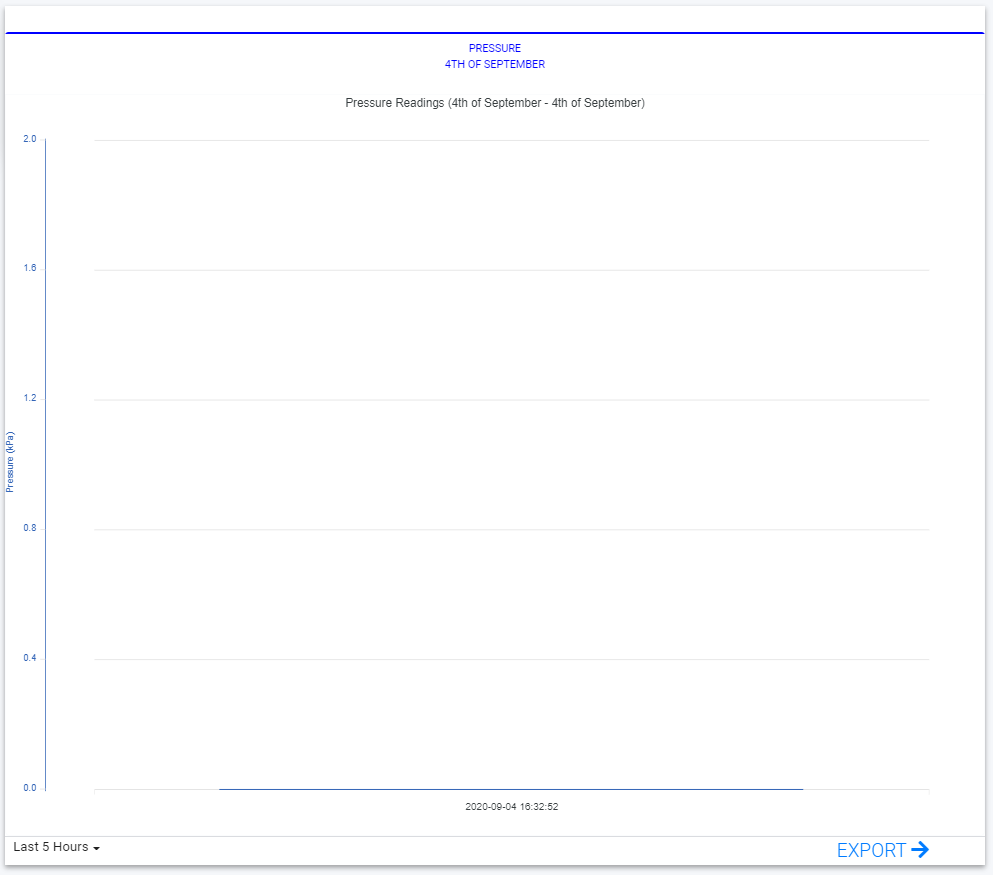
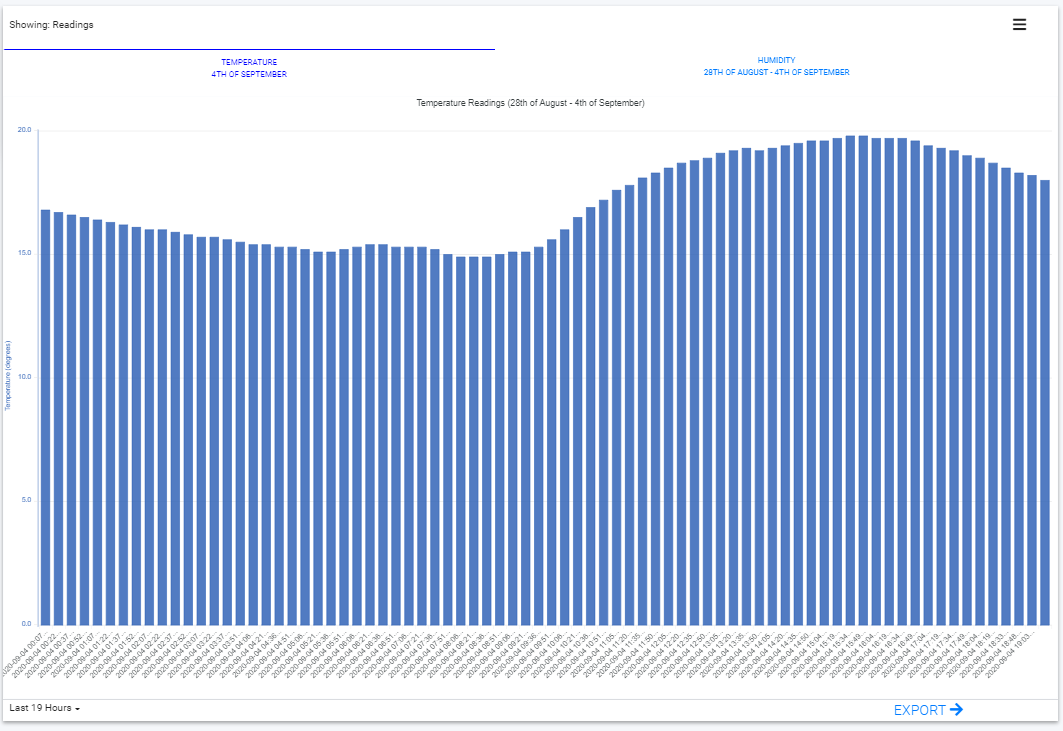
7. The Usage graph showcases the readings over the selected date
range.
Video
Watch Video
Viewing Device Readings
(Smart Thermo) Add Devices
Smart Thermo Readings
How to display Smart Thermo device readings?
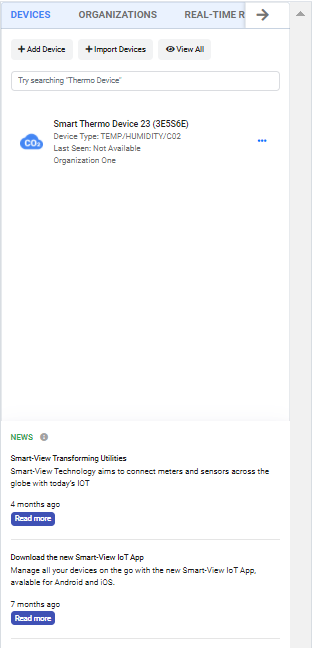
1. From the Smart-View IoT Smart Thermo dashboard navigate to the
side controller(navigation bar) for the list of Smart Thermo devices.
2. By Default there will be a Smart Thermo Device on the Dashboard,
click on the device you wish to view from the side controller and it will pull through on the
Dasboard.
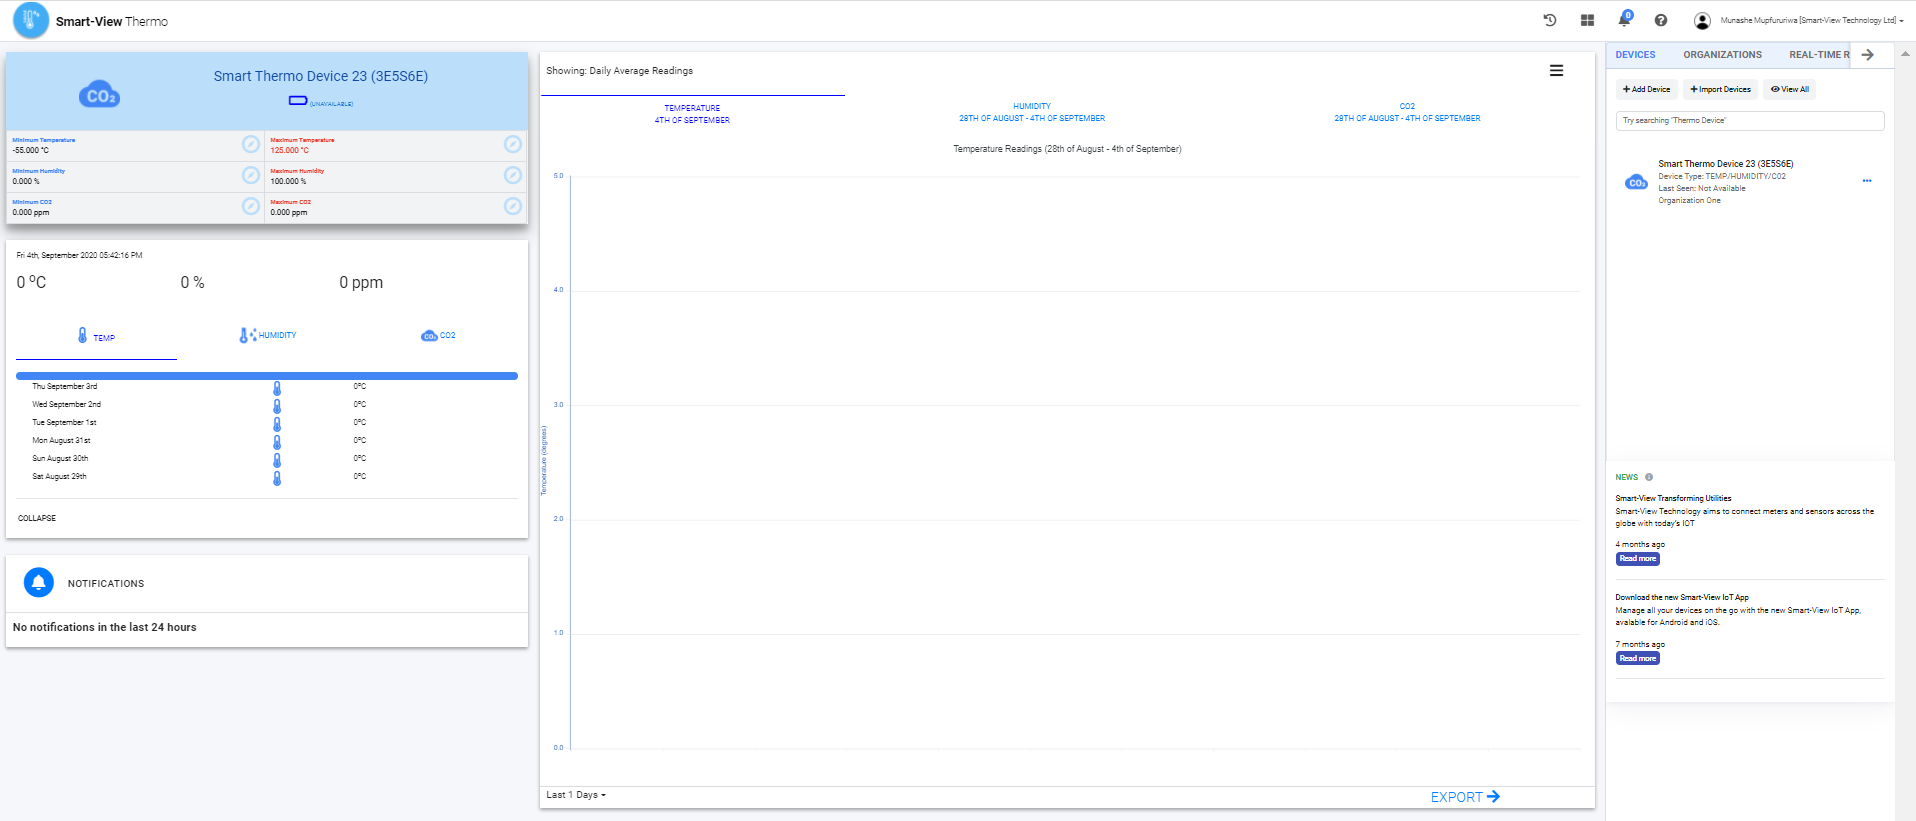
3. The Top left card showcases the device's information (name,
battery status & thresholds)
4. The Center left card showcases the device's daily average
readings for the last 6 days
5. The Bottom left card showcases the device's threshold breaches
notifications in the last 24 hours
7. The Usage graph showcases the readings over the selected date
range.
Update Device/Organization
(Smart Utilities) Permissions
Smart Utilities Readings
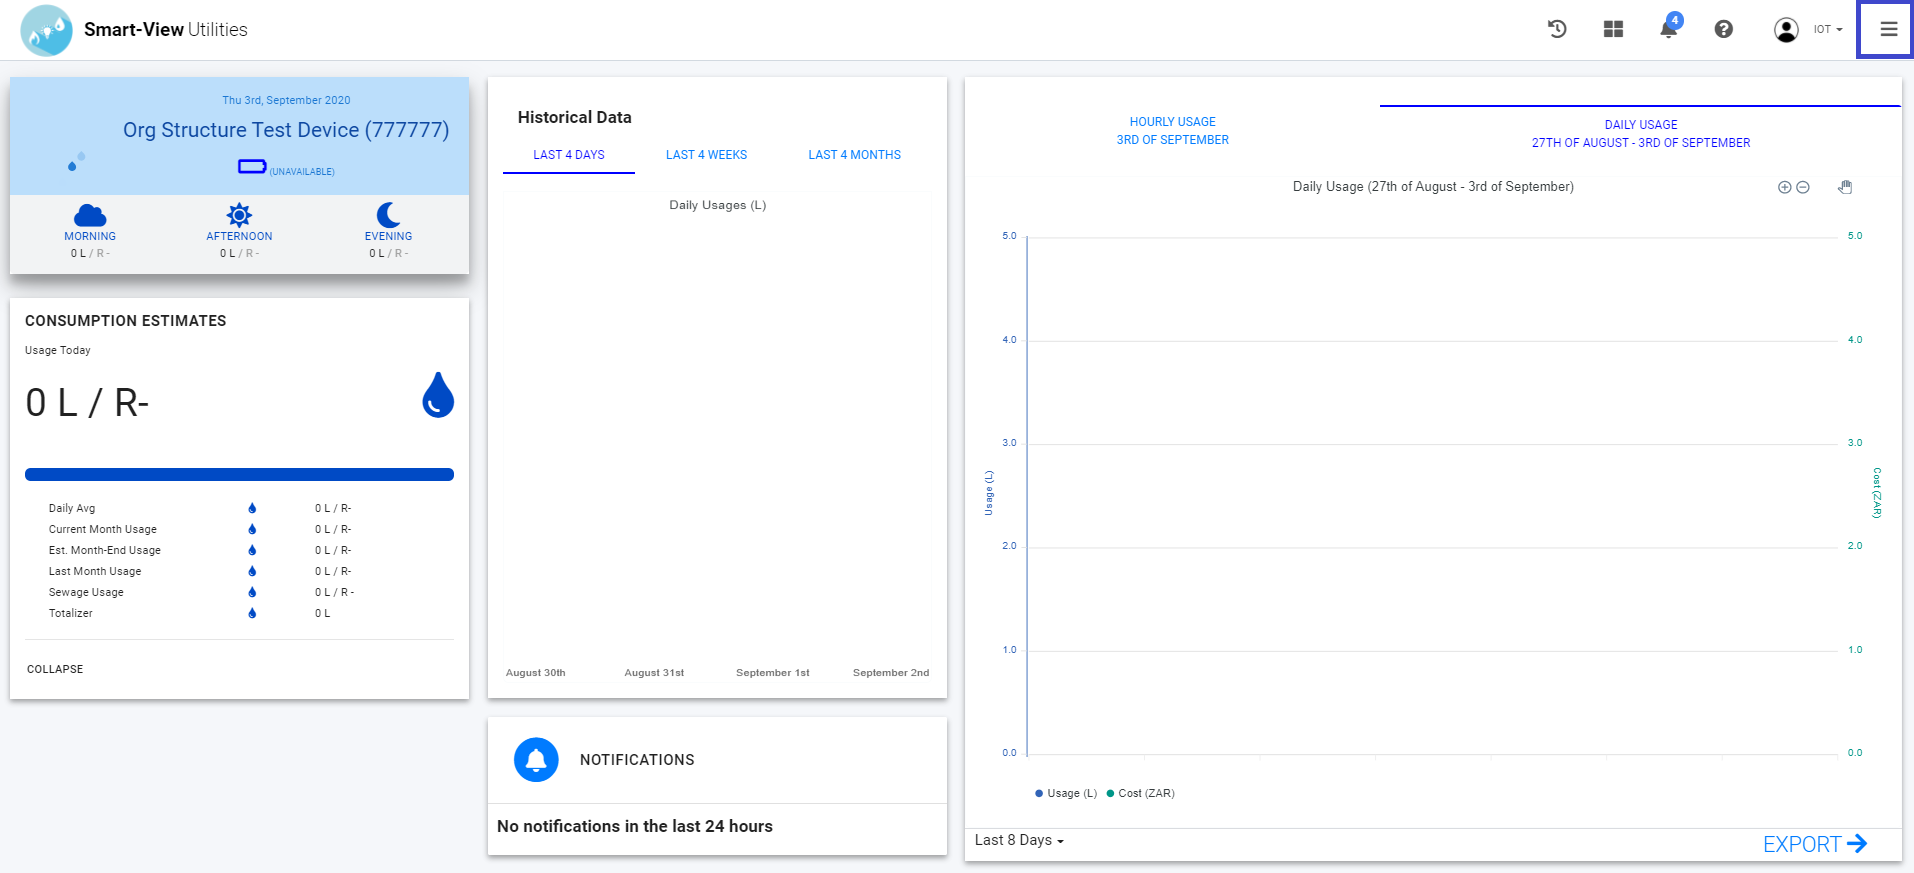
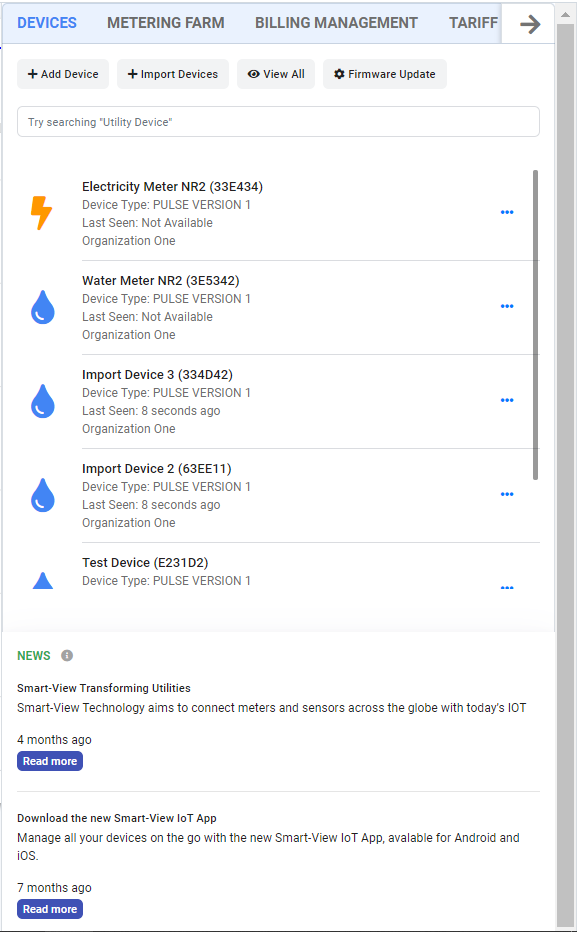
How to display Smart Utilities device readings?
1. From the Smart-View IoT Smart Thermo dashboard navigate to the
side controller(navigation bar) for the list of Smart Thermo devices.
2. By Default there will be a Smart Thermo Device on the Dashboard,
click on the device you wish to view from the side controller and it will pull through on the
Dasboard.
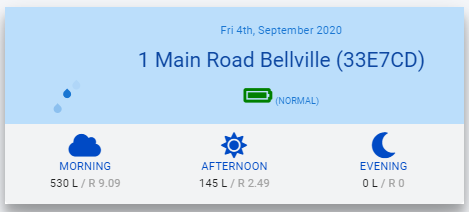
3. The top left card showcases the device's information (name,
battery status & day period usages - morning, afternoon & evening)
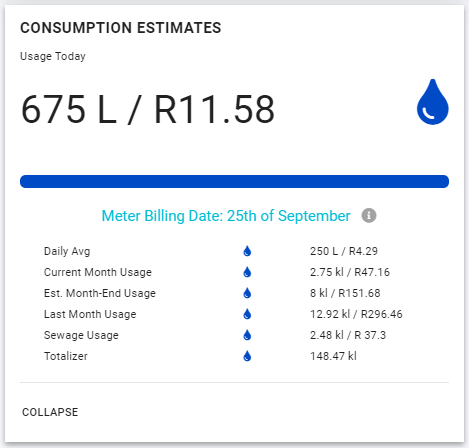
4. The bottom left card showcases the device's consumption
estimates.
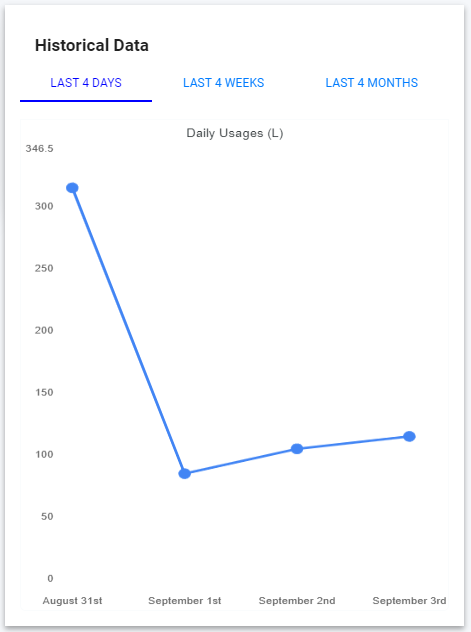
5. The top center card showcases the device's historical data over 4
days, 4 weeks & 4 months
6. The bottom center card showcases the device's notifications
(Breaches detected in the last 24 hours)
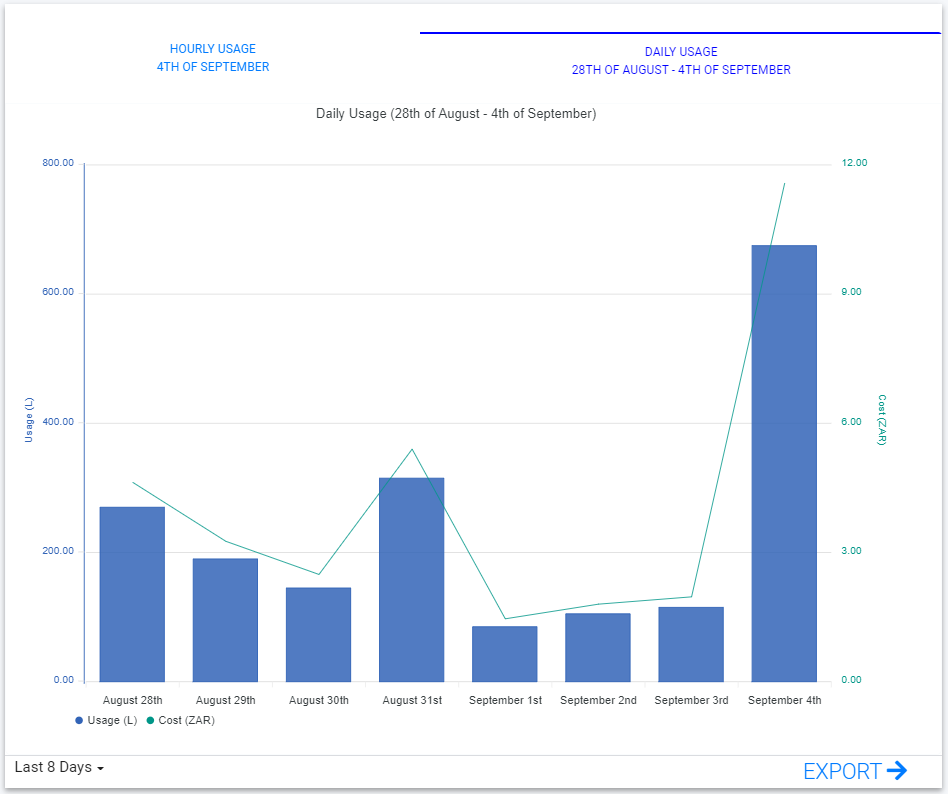
7. The Usage graph showcases the readings over the selected date
range.
Update Device/Metering Farm
(Tariff Management) Add Tariffs